Candle Patterns Strategy//I saw this code from DanyChe, i modify it to work on the latest version of pinescript
//The script allows you to test popular candlestick patterns on various instruments and timeframes. In addition, you can configure risk management (if the value is zero, it means the function is disabled), and you can also specify the time of the trading session (for example, so that the positions are not transferred to the next day).
//The author is grateful to JayRogers and Phi35, their code examples helped a lot in writing the strategy.
ابحث في النصوص البرمجية عن "the script"
Open Close Cross Strategy R5 revised by JustUncleLThis revision is an open Public release, with just some minor changes. It is a revision of the Strategy "Open Close Cross Strategy R2" originally published by @JayRogers.
*** USE AT YOUR OWN RISK ***
JayRogers : "There are drawing/painting issues in pinescript when working across resolutions/timeframes that I simply cannot fix here.. I will not be putting any further effort into developing this until such a time when workarounds become available."
NOTE: Re-painting has not been observed with the default set up, nor with Alternate resolution multiplier up to 5.
Description:
Strategy based around Open-Close Moving Average Crossovers optionally from a higher time frame.
Setup:
I have generally found that setting the strategy resolution to 3-5x that of the chart you are viewing tends to yield the best results, regardless of which MA option you may choose (if any) BUT can cause a lot of false positives - be aware of this. JustUncleL: using one of the Smoothed MA helps reduce false positives.
Don't aim for perfection. Just aim to get a reasonably snug fit with the O-C band, with good runs of green and red. JustUncleL: using SMMA (8 to 10) gives a good fit.
Option to either use basic open and close series data, or pick your poison with a wide array of MA types.
Optional Stop Loss and Target Profit for damage mitigation if desired (can be toggled on/off)
Positions get taken automatically following a crossover - which is why it's better to set the resolution of the script greater than that of your chart, so that the trades get taken sooner rather than later.
If you make use of the stops/target profit, be sure to take your time tweaking the values. Cutting it too fine will cost you profits but keep you safer, while letting them loose could lead to more draw down than you can handle.
Revsion R5 Changes by JustUncleL
Corrected cross over calculations, sometimes gave false signals.
Corrected Alternate Time calculation to allow for Daily,Weekly and Monthly charts.
Open Public release.
Revision R4 By JustUncleL
Change the way the Alternate resolution in selected, use a Multiplier of the base Time Frame instead, this makes it easy to switch between base time frames.
Added TMA and SSMA moving average options. But DEMA is still giving the best results.
Using "calc_on_every_tick=false" ensures results between back testing and real time are similar.
Added Option to Disable the coloring of the bars.
Updated default settings.
R3 Changes by JustUncleL:
Returned a simplified version of the open/close channel, it shows strength of current trend.
Added Target Profit Option.
Added option to reduce the number of historical bars, overcomes the too many trades limit error.
Simplified the strategy code.
Removed Trailing Stop option, not required and in my option does not work well in Trading View, it also gives false and unrealistic performance results in back testing.
R2 Changes by @JayRogers:
Simplified and cleaned up plotting, now just shows a Moving Average derived from the average of open/close.
Tried very hard to alleviate painting issues caused by referencing alternate resolution.

XRP Non-Stop Strategy (TP 25% / SL 15%)This strategy performs continuous automated trading exclusively on XRP. It opens long positions during favorable trend conditions, using a fixed Take Profit target of 25% above the entry price and a fixed Stop Loss of 15% below the entry. Once a trade is closed (either TP or SL), the strategy automatically re-enters on the next valid signal, enabling uninterrupted trading.
The script includes:
Dynamic Take Profit & Stop Loss lines
Optional EMA trend filter
Visual BUY and EXIT markers
TradingView alerts for automation or notifications
This strategy is built for traders who want a simple, price-action-driven system without fixed price levels, relying only on percentage-based movement from each entry.

Risk-Managed StrategyRisk-Managed Strategy is a complete algorithmic trading framework that blends multiple technical systems—RSI, MACD, EMA crossover, Bollinger Bands, and SuperTrend—into a unified signal engine.
The script dynamically calculates position size based on capital, risk percentage, ATR-based stop loss, and reward-ratio targets.
It features:
-Multi-indicator signal voting (BUY / SELL / NEUTRAL)
- Dynamic capital tracking across trades
- Automatic position sizing based on risk amount
- Auto-generated Stop Loss and Take Profit using recent highs/lows
- On-chart SL, TP, and CMP plotting for clarity
This strategy is designed for traders who want a professional, rule-based system that balances accuracy, risk control, and automation.
Disclaimer:
The information provided is for educational and informational purposes only. It does not constitute financial or investment advice. Trading and investing in stocks involves risk, including the possible loss of capital. Any decisions to buy, sell, or hold securities are the sole responsibility of the reader. Past performance is not indicative of future results. Always do your own research and, if necessary, consult with a licensed financial advisor before making investment decisions.

FX Swing — Compact Auto-Sizing (Fixed)A compact Forex swing-trading strategy that combines higher-timeframe EMA trend bias, EMA pullback confirmation, and RSI momentum filtering. It automatically sizes positions using either risk-percentage or fixed-risk, adapts pip values for JPY and non-JPY pairs, and generates clear SL/TP levels with partial take-profit exits. The script also sends structured JSON alerts for webhooks or WhatsApp automation, making it ideal for fast, disciplined, and risk-controlled swing entries.
Institution Accumulation/DistributionLeveraging the Williams%R oscillator, the script has been optimized to pick out key turning point in the market specifically at Resistance (Overbought) or Support (Oversold)
The algo has been programmed to print both buy and sell alerts at extremes/when conditions flip eg a long position will be closed simultaneously opening a short position above resistance.
Best used as a scalping tool targeting 30m and below works well with currency pairs

Swing FX Pro Panel v1Description:
"Swing FX Pro Panel v1" is a professional swing trading strategy tailored for the Forex market and other highly liquid assets. The core logic is based on the crossover of two Exponential Moving Averages (EMA), allowing the strategy to detect trend shifts and generate precise entry signals.
The script includes an interactive performance panel that dynamically displays:
initial capital,
risk per trade (%),
the number of trades taken during a selected period (e.g., 6 months),
win/loss statistics,
ROI (Return on Investment),
maximum drawdown,
win ratio.

EMA and Dow Theory Strategies🌐 Strategy Description
📘 Overview
This is a hybrid strategy that combines EMA crossovers, Dow Theory swing logic, and multi-timeframe trend overlays. It is suitable for intraday to short-term trading on any asset class: crypto, forex, stocks, and indices.
The strategy provides precise entry/exit signals, dynamic stop-loss and scale-out, and highly visual trade guidance.
🧠 Key Features
・Dual EMA crossover system (applied to both symbol and external index)
・Dow Theory-based swing high/low detection for trend confirmation
・Visual overlay of higher timeframe swing trend (htfTrend)
・RSI filter to avoid overbought/oversold entries
・Dynamic partial take-profit when trend weakens
・Custom stop-loss (%) control
・Visualized trade PnL labels directly on chart
・Alerts for entry, stop-loss, partial exit
・Gradient background zones for swing zones and trend visualization
・Auto-tracked metrics: APR, drawdown, win rate, equity curve
⚙️ Input Parameters
| Parameter | Description |
| ------------------------- | -------------------------------------------------------- |
| Fast EMA / Slow EMA | Periods for detecting local trend via EMAs |
| Index Fast EMA / Slow EMA | EMAs applied to external reference index |
| StopLoss | Maximum loss threshold in % |
| ScaleOut Threshold | Scale-out percentage when trend changes color |
| RSI Period / Levels | RSI period and overbought/oversold levels |
| Swing Detection Length | Number of bars used to detect swing highs/lows |
| Stats Display Options | Toggle PnL labels and position of statistics table |
🧭 About htfTrend (Higher Timeframe Trend)
The script includes a higher timeframe trend (htfTrend) calculated using Dow Theory (pivot highs/lows).
This trend is only used for visual guidance, not for actual entry conditions.
Why? Strictly filtering trades by higher timeframe often leads to missed opportunities and low frequency.
By keeping htfTrend visual-only, traders can still refer to macro structure but retain trade flexibility.
Use it as a contextual tool, not a constraint.
ストラテジー説明
📘 概要
本ストラテジーは、EMAクロスオーバー、ダウ理論によるスイング判定、**上位足トレンドの視覚表示(htfTrend)**を組み合わせた複合型の短期トレーディング戦略です。
仮想通貨・FX・株式・指数など幅広いアセットに対応し、デイトレード〜スキャルピング用途に適しています。
動的な利確/損切り、視覚的にわかりやすいエントリー/イグジット、統計表示を搭載しています。
🧠 主な機能
・対象銘柄+外部インデックスのEMAクロスによるトレンド判定
・ダウ理論に基づいたスイング高値・安値検出とトレンド判断
・上位足スイングトレンド(htfTrend)の視覚表示
・RSIフィルターによる過熱・売られすぎの回避
・トレンドの弱まりに応じた部分利確(スケールアウト)
・**損切り閾値(%)**をカスタマイズ可能
・チャート上に損益ラベル表示
・アラート完備(エントリー・決済・部分利確)
・トレンドゾーンを可視化する背景グラデーション
・勝率・ドローダウン・APR・資産増加率などの自動表示
| 設定項目名 | 説明内容 |
| --------------------- | -------------------------- |
| Fast EMA / Slow EMA | 銘柄に対して使用するEMAの期間設定 |
| Index Fast / Slow EMA | 外部インデックスのEMA設定 |
| 損切り(StopLoss) | 損切りラインのしきい値(%で指定) |
| 部分利確しきい値 | トレンド弱化時にスケールアウトする割合(%) |
| RSI期間・水準 | RSI計算期間と、過熱・売られすぎレベル設定 |
| スイング検出期間 | スイング高値・安値の検出に使用するバー数 |
| 統計表示の切り替え | 損益ラベルや統計テーブルの表示/非表示選択 |
🧭 上位足トレンド(htfTrend)について
本スクリプトには、上位足でのスイング高値・安値の更新に基づく**htfTrend(トレンド判定)が含まれています。
これは視覚的な参考情報であり、エントリーやイグジットには直接使用されていません。**
その理由は、上位足を厳密にロジックに組み込むと、トレード機会の損失が増えるためです。
このスクリプトでは、**判断の補助材料として「表示のみに留める」**設計を採用しています。
→ 裁量で「利確を早める」「逆張りを避ける」判断に活用可能です。

Scalping 15min: EMA + MACD + RSI + ATR-based SL/TP📈 Strategy: 15-Minute Scalping — EMA + MACD + RSI + ATR-based SL/TP
This scalping strategy is designed for 15-minute charts and combines trend-following and momentum confirmation with dynamic stop loss and take profit levels based on volatility.
🔧 Indicators Used:
EMA 50 — identifies the main trend
MACD Histogram — confirms momentum direction
RSI (14) — filters overbought/oversold conditions
ATR (14) — dynamically sets SL and TP based on market volatility
📊 Entry Conditions:
Long Entry:
Price is above EMA 50
MACD histogram is positive
RSI is above 50 but below 70
Short Entry:
Price is below EMA 50
MACD histogram is negative
RSI is below 50 but above 30
🛑 Risk Management:
Stop Loss: 1×ATR (user-configurable)
Take Profit: 2×ATR (user-configurable)
These values can be adjusted in the script inputs depending on your risk/reward preference or market conditions.
⚠️ Notes:
Strategy is optimized for scalping fast-moving pairs (e.g. crypto, forex).
Works best in trending markets.
Use backtesting and forward testing before live trading.

New intraday high with weak barStrategy Logic:
The strategy checks if the current bar’s high is the highest high of the last 10 bar and if internal bar strength is less than 0.15.
Position is closed when close is greater than the previous bar’s high.
When a position is open, the script applies a light green background on the chart to signal that you are in a trade.
Monthly Returns of a Strategy in a ChartIt's a simple example of how you can present your strategy's monthly performance in a chart.
You maybe know that there is no support of these kind of charts in TradingView so this chart is actually a table object under the hood.
Table visual appearance is customizable, you can change:
Location
Bar Width / High
Colors
Thanks to @MUQWISHI for hard work, for helping me coding it.
It's not about the strategy itself but the way you display returns on your chart. So pls don't critique my choice of the strategy and its performance 🙂
Disclaimer
Please remember that past performance may not be indicative of future results.
Due to various factors, including changing market conditions, the strategy may no longer perform as well as in historical backtesting.
This post and the script don’t provide any financial advice.

Scalping Support Resistance StrategyScalping strategy for BTC using one line: Support Resistance.
The strategy draws a line based on the minimum value of the average of High, Low, and Close for a given bar. The entries are carried out on the breakdown of this line. Exits are managed by the specified in the script's inputs take-profit and stop-loss percentages.
From Stream:
www.tradingview.com

Bollinger Bands + EMA 9A 1 minute scalping strategy.
Uses Bollinger Bands (no basis line) and a 9 period EMA.
Waits for price to close below the lower Bollinger Band and the next candle to close bullish above the lower Bollinger Band but below the 9 Period EMA.
If all conditions are met, the script enters a long position with TP at the 9 Period EMA.

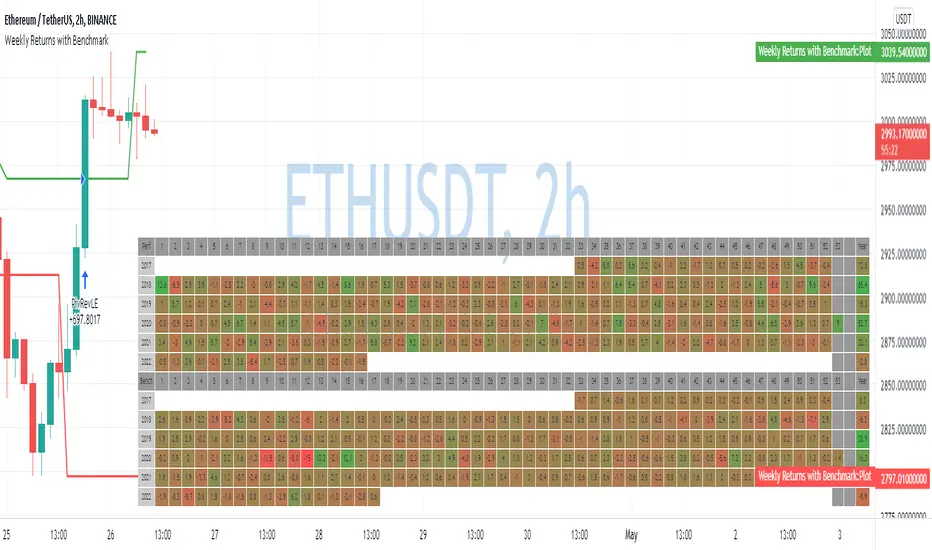
Weekly Returns with BenchmarkSome time ago I published Monthly returns table. Now It's time for weekly one.
To get it work you need a pretty big screen, but I hope it will be useful for some of you.
Features of this table includes:
Display weekly returns of your strategy, benchmark, and alpha over this benchmark.
Select benchmark to be another instrument
Select the date from which you want to compute monthly returns
Show/hide benchmark and alpha
Choose colors for gradient for gain/loss values
Use it with any type of strategy
Use it with replay
Thanks to @MUQWISHI to help me coding it.
It's not about the strategy itself but the way you display returns on your chart. So pls don't critique my choice of the strategy and its performance 🙂
Disclaimer
Please remember that past performance may not be indicative of future results.
Due to various factors, including changing market conditions, the strategy may no longer perform as well as in historical backtesting.
This post and the script don’t provide any financial advice.
MA cross strategyI created an sma (10/30) strategy.
The script is under construction and can be changed, since i'm looking for a more profitable strategy.
If you have ideas to make it more profitable, please comment.
It is possible to change everything to your own needs.
Small short for CryptoThis is the third modification of VuMAnChu cipher B indicator designed only for short sales.
The trigger signal is called sommi bearish diamond (according to my due diligence it has the best performance)
You can either fix a stop loss value or close position after crossing sma line.
Take profit also can be tuned.
Keep in mind that short positions are very risky, so deposit your money to the market only after your research. I guess this indicator has potential for repainting, so track backtests/forward tests carefully. The script is for entertainment purposes only.
Good luck and have fun!

Donchian Breakout no repaintdonchian breakout strategy which i revise the script for no repaint signal
Day of Week Custom Buy/Sell StrategyThis strategy was made for bitcoin and allows you to back test longing or shorting for various days of the week. The price may tend to go in one direction or another for each week day, and this strategy allows you to test days across a range of dates to capitalize on this.
Make sure you are on the daily time frame while viewing the performance and trade history to ensure the script works as intended and you have the most historical data as possible from Trading View.

Donchian Channels strategy with backtestHere's another trading strategy for you. This one is based on the standard Donchian Channels.
This one will - by default - wait for 2 consecutive higher highs (or lower lows) before taking a position. This can be disabled so the script will take a new trade without waiting for the 2nd high or low.
This is useful to avoid getting into a trade when market makers are aiming for a swing-failure pattern (= taking out stop/losses below the last low or above the last high)
For people who don't like to short, there's also the option to exclude shorts.
Enjoy!
EmperorBTC's VWAP StrategyEmperorBTC's VWAP Indicator & Strategy
v2.1
coded by Bogdan Vaida
This indicator was created after EmperorBTC's conditions.
Good timeframes for it: 30', 15', 5'
To convert from strategy to study switch the commented lines in the beginning
and at the end of the script and vice versa.
What this indicator does is to check if:
o Pivot Point was crossed
o Stoch-RSI and VWAP were crossed in current or previous candle
o Candle (or previous candle) close is in the trend direction
If all these are true then it will go long or short based on direction.

ABUs EurorampThis strategy backtests the opening ramp of Europe at 9am European time, which is 2am Chicago time ( CME ES timezone ) on the ES Futures Contract.
The following conditions are embedded in the strategy:
- Market entry at 2 am Chicago time
- Size = 2 contracts
- Stop = -5 points
- TP 1 = +3 points (1 Contract)
- Stop to Break even (entry + 0.5) after TP 1 is reached
- Set a TP 2 stop to +5 if entry is +10 points
- Close all positions EOD RTH
As the script entry / stops / TPs work on candle closes, best is to use the strategy on the 5min chart.

Simple and efficient MACD crypto strategy with risk managementToday I am glad to bring you another great creation suited for crypto markets.
MARKET
Its a simple and efficient strategy, designed for crypto markets( btcusd , btcusdt and so on), and suited for for higher time charts : like 1hour, 4hours, 1 day and so on.
Preferably to use 1h time charts.
COMPONENTS
MACD with simple moving average
ENTRY DESCRIPTION
For entries we have :
We check the direction with MACD . Depending if its an uptrend and positive level on histogram of MACD we go long, otherwise we go short.
RISK MANAGEMENT
In this strategy we use a stop loss based on our equity. For this example I choosed a 2% risk .That means if our account has 100.000 eur, it will automatically close the trade if we lose 2.000.
We dont use a take profit level.
In this example also we use a 100.000 capital account, risking 5% on each trade, but since its underleveraged, we only use 5000 of that ammount on every trade. With leveraged it can be achieved better profits and of course at the same time we will encounter bigger losses.
The comission applied is 5$ and a slippage of 5 points aswell added.
For any questions or suggestions regarding the script , please let me know.

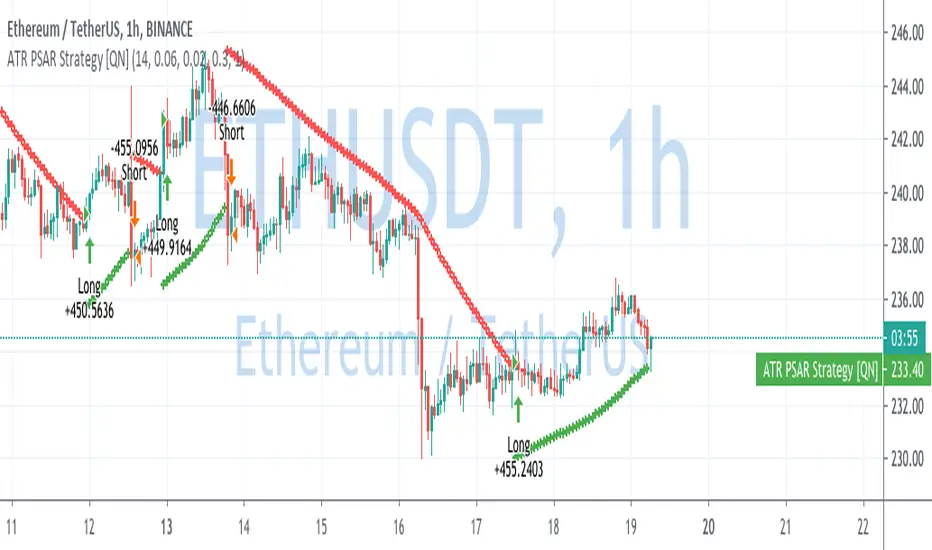
ATR Parabolic SAR Strategy [QuantNomad]I created a version of Parabolic SAR when I accelerate it not based on the difference from the extreme point but based on current ATR. So the idea is that for a more volatile market it should move faster.
Performance is calculated based on 25% equity invested and 0.1% commission.
What do you think about it? Does it make sense to do something like that?
Do you have in mind other ways I can accelerate it when the market starts to be more volatile?
Disclaimer
Please remember that past performance may not be indicative of future results.
Due to various factors, including changing market conditions, the strategy may no longer perform as good as in historical backtesting.
This post and the script don’t provide any financial advice.